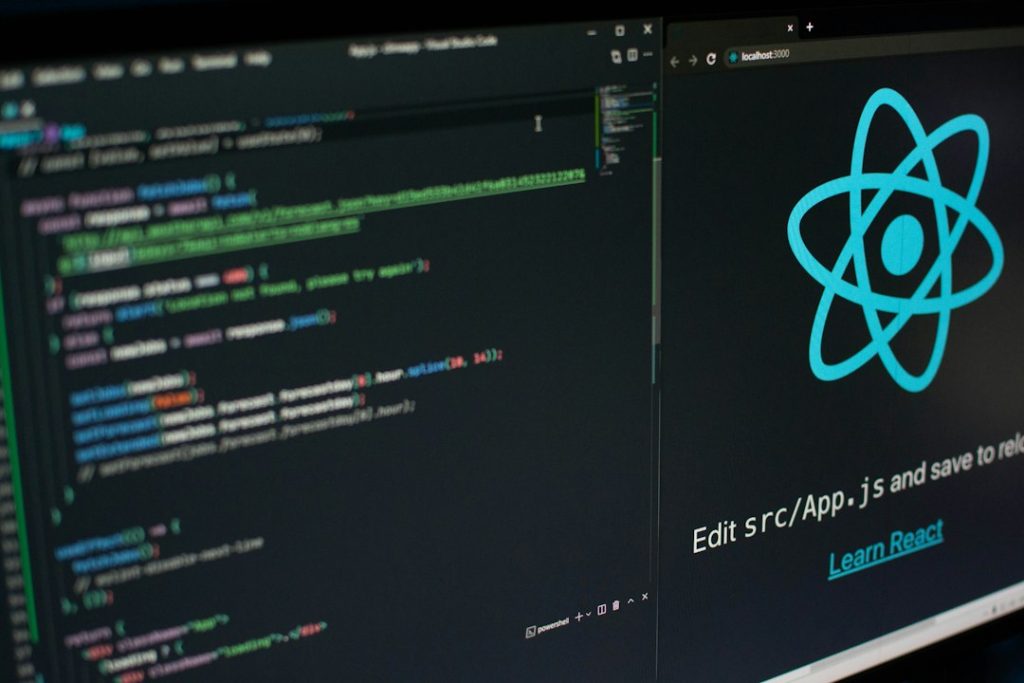
A Flask dashboard tutorial Python teaches you how to build interactive web dashboards using Flask, a lightweight Python web framework, combined with data visualization libraries and database integration. This guide covers everything from project setup through production deployment, enabling you to create responsive, real-time dashboards that display business intelligence and analytics with clean, professional interfaces.
What Is Flask and Why Build Dashboards With It?
Flask is a minimalist Python web framework that gives you complete control over your dashboard architecture without forcing unnecessary abstractions or dependencies. Unlike heavier frameworks that bundle everything together, Flask lets you choose exactly which tools and libraries fit your dashboard requirements.
Flask fundamentals for dashboard development
Flask operates as a microframework—it handles HTTP routing, template rendering, and request handling, leaving visualization, database operations, and styling to libraries you select. This approach means you build precisely what you need, nothing more. Python Playwright Login Automation Tutorial
At its core, Flask uses decorators to map URLs to Python functions. A dashboard application starts with a simple route that renders an HTML template and passes data from your backend to the frontend: Automate Repetitive Tasks with Python
The framework processes incoming requests, executes your Python logic (database queries, calculations, data transformations), and returns rendered HTML with embedded data. This separation between business logic and presentation keeps your dashboard code maintainable and scalable.
Advantages of Flask over heavier frameworks
Flask offers several advantages when building dashboards compared to larger frameworks like Django or specialized tools like Dash. First, flexibility in architecture means you structure your project to match your data flow, not conform to a predefined pattern.
- Lightweight footprint: Minimal dependencies translate to faster deployment and lower server resource consumption
- Freedom in frontend choice: Use any JavaScript charting library, CSS framework, or frontend library that suits your needs
- Simple API development: Build RESTful APIs within the same application to serve dashboard data to frontend components
- Easy debugging: The development server provides clear error messages and integrates seamlessly with Python debugging tools
- Cost-effective hosting: Runs efficiently on modest hardware or containerized environments, reducing infrastructure expenses
Django, by contrast, includes an admin panel, ORM, and template engine as a complete package—useful for large applications but often overkill for focused dashboard projects. Dash, Streamlit, and similar tools abstract away web fundamentals, which accelerates initial development but limits customization when dashboards require specific features.
Real-world dashboard use cases and applications
Flask dashboards solve concrete business problems across industries. A SaaS analytics platform uses Flask to aggregate customer usage data and display performance metrics in real time. Financial organizations build Flask dashboards to monitor trading activity, portfolio performance, and risk indicators.
E-commerce companies track inventory levels, sales trends, and customer behavior through Flask-powered dashboards. Internal operations teams use Flask dashboards to oversee server health, application performance, and system logs. The flexibility of Flask accommodates:
- Single-page applications displaying live streaming data with WebSocket updates
- Multi-tenant dashboards where different users see filtered datasets based on permissions
- Complex analytical interfaces combining tables, charts, and interactive filters
- Embedded dashboards integrated into larger applications
- Automated report generation with scheduled PDF or email distribution
How Do You Set Up a Flask Development Environment?
Before writing dashboard code, establish a proper development environment that isolates your project dependencies and provides a consistent workspace. This prevents conflicts between different Python projects and ensures reproducibility across machines.

Installing Python and Flask dependencies
Start by verifying Python 3.8 or later is installed on your system. Open a terminal and run python --version to check your Python installation. Flask requires only Python and pip (Python’s package manager), which installs automatically with Python 3.4+.
Create a project directory and navigate into it. This is where your Flask application code, templates, and static files will live. Organize your structure clearly from the start to maintain order as your dashboard grows.
Configuring virtual environments for project isolation
Virtual environments are essential for Python development. They create isolated spaces where your project dependencies don’t conflict with system-wide Python packages or other projects.
Create a virtual environment by running python -m venv venv in your project directory. This generates a venv folder containing Python, pip, and a copy of the standard library specific to your project.
Activate your virtual environment with source venv/bin/activate on macOS/Linux or venvScriptsactivate on Windows. Your terminal prompt changes to show the active environment name, confirming activation.
Install Flask and common dashboard dependencies using pip. Run pip install Flask to get Flask itself, then add other packages as needed:
pip install Flask-SQLAlchemyfor database integrationpip install python-dotenvfor environment variable managementpip install Flask-Loginfor user authenticationpip install Gunicornfor production deployment
Record your installed packages in a requirements.txt file. Run pip freeze > requirements.txt to generate this file automatically. Other developers can then recreate your environment exactly by running pip install -r requirements.txt.
Verifying your Flask installation and running the development server
Create a simple test file called app.py to verify everything works. This minimal Flask application confirms your installation and demonstrates the basic structure:
In your activated virtual environment, run python app.py. The Flask development server starts and typically listens on http://127.0.0.1:5000. Open this URL in your browser to see the “Hello World” message.
The development server automatically reloads when you modify code, speeding up the development cycle. When you’re ready to stop the server, press Ctrl+C in the terminal.
Never use the development server in production. It’s slow, not designed for concurrent requests, and lacks security features. For production, you’ll deploy Flask with a proper application server like Gunicorn behind a reverse proxy (nginx or Apache).
Building Your First Flask Dashboard: Step-by-Step Implementation
A functional dashboard requires three components working together: a Flask backend that manages data and routes, Jinja2 templates that render HTML with embedded data, and CSS styling that makes dashboards visually appealing. Let’s build this systematically.

Creating project structure and application factory pattern
Organize your Flask project from the start using a structure that scales. The application factory pattern separates application creation from initialization, making testing and configuration easier.
Create a project structure like this:
app/– Main package directory containing all application codeapp/__init__.py– Application factory that creates and configures Flask instancesapp/routes.py– URL routes and view functionsapp/models.py– SQLAlchemy database models (if using a database)app/templates/– HTML template filesapp/static/– CSS, JavaScript, and image filesrun.py– Entry point that starts your applicationconfig.py– Configuration settings for different environments
The application factory pattern centralizes Flask instantiation. In app/__init__.py, create a function that returns a configured Flask application instance. This approach enables running multiple instances with different configurations without code duplication.
In run.py, import the factory function and create your application, then run it. This separation means your templates and static files import correctly regardless of how the application starts, whether from the development server, tests, or production deployment.
Rendering HTML templates with Jinja2
Jinja2 is Flask’s default template engine. It lets you embed Python logic in HTML files, enabling dynamic content generation. Create a templates folder in your app directory and add HTML files there.
A basic dashboard template looks like this structure: Flask receives data in the view function and passes it to the template, which renders it as HTML. Jinja2 syntax uses {{ variable }} for variables, {% for item in items %} for loops, and {% if condition %} for conditionals.
Create a base template that other templates extend, establishing consistent navigation and styling across your dashboard. Use Jinja2’s {% block content %} syntax to define areas where child templates inject specific content.
Passing data from Flask backend to frontend templates
The connection between Python and HTML happens through template rendering. When a view function executes, it calculates or retrieves data, then passes it to a template for display.
In your Flask route, query or calculate the data your dashboard needs. Then use render_template() to pass this data to HTML:
In this example, render_template() takes the template filename and keyword arguments containing data. The template accesses these variables by name. For more complex data structures, pass dictionaries or lists of objects—Jinja2 handles iteration and attribute access automatically.
Minimize business logic in templates. Keep templates focused on presentation, moving calculations and database queries to your Python view functions. This separation makes your code easier to test and maintain.
Styling dashboards with CSS frameworks and Bootstrap
Bootstrap is the standard choice for building professional, responsive dashboards without writing extensive custom CSS. It provides pre-built components (buttons, cards, forms, grids) that work across devices and browsers.
Include Bootstrap via CDN in your base template’s <head> section:
Bootstrap’s grid system organizes content into 12 columns. Use Bootstrap classes to create responsive layouts that adapt to mobile, tablet, and desktop screens. Cards, alerts, tables, and navigation components give your dashboard a polished appearance with minimal effort.
For custom styling beyond Bootstrap, create CSS files in your static/css/ directory and link them in your templates. Keep CSS organized by feature or page section for maintainability.
Which Charting Libraries Integrate Best With Flask Dashboards?
Data visualization transforms raw numbers into insights. Several excellent JavaScript charting libraries integrate seamlessly with Flask, each offering different strengths. Choosing the right one depends on your dashboard requirements and complexity.
Chart.js for lightweight, responsive visualizations
Chart.js is ideal when you need quick, professional charts without heavy dependencies. It’s small, loads fast, and creates responsive, animated visualizations. Chart.js excels at standard charts: line, bar, pie, doughnut, and scatter plots.
Include Chart.js via CDN and create a canvas element in your HTML. Pass JSON data from Flask to JavaScript, which renders the chart. The library handles responsiveness automatically, adapting to container size.
Chart.js is best for dashboards prioritizing speed and simplicity. It’s perfect for displaying KPIs, sales trends, and status summaries. The learning curve is minimal—most developers write working charts within minutes.
Plotly for interactive and professional-grade charts
Plotly creates beautiful, interactive visualizations with hover tooltips, zoom capabilities, and downloadable images. It supports more chart types than Chart.js and includes advanced features like 3D plots, geographic maps, and scientific visualizations.
Plotly works in two ways: use the Python library to create plots server-side and pass HTML to Flask templates, or use Plotly.js on the frontend and send JSON data from Flask.
Plotly produces publication-quality charts suitable for executive presentations and analytical deep-dives. The downside is larger file sizes and slightly slower rendering compared to Chart.js. Use Plotly when interactivity and sophisticated visualization matter more than minimal page load.
D3.js for custom, complex data visualizations
D3.js provides complete control over visualization design. It’s powerful but requires more development time and JavaScript knowledge. D3 excels at creating unique, custom visualizations that standard charting libraries can’t produce.
D3 is appropriate for specialized dashboards displaying complex data relationships, hierarchical information, or network visualizations. Most business dashboards don’t need D3’s power—Chart.js or Plotly handle typical requirements more efficiently.
Comparison of performance, ease of use, and customization options
Each library serves different priorities. This comparison helps you choose the right tool for your dashboard:
| Library | Performance | Ease of Use | Customization | Best Use Case |
|---|---|---|---|---|
| Chart.js | Very Fast | Very Easy | Moderate | Standard charts, fast dashboards |
| Plotly | Fast | Easy | High | Interactive analytics, professional reports |
| D3.js | Good | Difficult | Complete | Unique custom visualizations |
For most Flask dashboards, Chart.js and Plotly handle 90% of requirements. Start with Chart.js for simplicity, then add Plotly when you need interactivity or more sophisticated chart types.
How Do You Connect Flask Dashboards to Databases?
Dashboards display data, and data lives in databases. Connecting Flask to a database enables your dashboard to query, filter, and present real business information. SQLAlchemy makes this connection clean and Pythonic.
Using SQLAlchemy ORM for database operations
SQLAlchemy is a Python ORM (Object-Relational Mapping) library that translates between Python objects and database records. Instead of writing raw SQL, you define Python classes representing your data, then query them using Python syntax.
Flask-SQLAlchemy provides a Flask integration that simplifies database configuration. Define your models (Python classes) representing tables:
This model defines a User table with columns for id, username, email, and creation timestamp. SQLAlchemy handles the SQL generation, data type mapping, and query construction behind the scenes.
Query data using SQLAlchemy’s fluent API. Fetch all users, filter by specific criteria, or count records with simple Python method calls. The ORM translates these operations to efficient SQL.
Setting up PostgreSQL, MySQL, or SQLite connections
Flask works with multiple database systems. SQLite is built into Python and requires no server—perfect for development and small applications. PostgreSQL and MySQL are production-grade databases handling larger datasets and concurrent connections.
Configure your database connection in Flask settings. Use environment variables for sensitive credentials rather than hardcoding them in source code:
The database URI tells SQLAlchemy what database system to use and where to find it. For SQLite, it’s a local file path. For PostgreSQL or MySQL, it includes username, password, host, port, and database name.
In development, SQLite is sufficient and avoids the complexity of database server setup. In production, PostgreSQL is recommended for reliability, advanced features, and performance with larger datasets.
Writing efficient queries to feed dashboard data
Dashboard performance depends on query efficiency. Poor queries slow down page loads and waste database resources. Apply these principles when writing queries:
- Query only what you need: Use
.with_entities()orSELECTto fetch specific columns instead of entire records - Filter at the database: Apply WHERE conditions in SQL rather than retrieving all records and filtering in Python
- Limit result sets: Use
.limit()for pagination or when displaying top N items - Use relationships efficiently: Minimize database queries by loading related data strategically with eager loading
- Add database indexes: Index frequently filtered or sorted columns to speed lookups
For a dashboard displaying sales by region, fetch only necessary columns and group data at the database level:
This query returns aggregated data in a single database operation. Doing the same aggregation in Python would require fetching thousands of individual records.
Handling real-time data updates and refresh strategies
Some dashboards need live data updates without page refreshes. Several approaches provide this functionality with different complexity levels.
Polling is the simplest approach: JavaScript periodically requests fresh data from the server via AJAX. It’s easy to implement but generates unnecessary requests when data hasn’t changed.
WebSockets enable server-to-client communication, pushing updates immediately when data changes. This is more efficient but requires additional infrastructure and complexity.
Caching reduces database load. Cache frequently accessed data for minutes to hours, depending on how fresh data needs to be. Use Redis or simple in-memory caching for frequently queried results.
What Authentication and Security Measures Are Essential?
Dashboards often display sensitive business information. Protecting access with authentication and authorization ensures only appropriate users see relevant data. Security is non-negotiable in production systems.
Implementing user login systems with Flask-Login
Flask-Login handles user session management. It tracks logged-in users, maintains sessions, and provides decorators to protect routes requiring authentication.
Create a User model with username and password fields. Never store plaintext passwords—use secure hashing with werkzeug.security:
Create login and registration routes. The login route validates credentials against hashed passwords, then creates a session. The @login_required decorator protects routes, redirecting unauthenticated users to login.
Store passwords securely using bcrypt or similar algorithms. Flask-Login handles session management transparently—once logged in, users remain authenticated across requests without re-entering credentials each time.
Protecting sensitive dashboard data with role-based access control
Role-based access control (RBAC) ensures users see only data they’re authorized to access. Extend your User model to include roles:
Create custom decorators that check user roles before allowing access:
Apply role-checking decorators to sensitive routes. A financial dashboard might restrict profit and loss data to executives, showing only department-level metrics to managers.
This approach scales as your organization grows. Add new roles and permissions without restructuring core authentication logic.
Securing API endpoints and preventing common vulnerabilities
If your dashboard exposes API endpoints for data access, secure them thoroughly. Always validate input to prevent SQL injection and cross-site scripting (XSS):
- Input validation: Check data types, lengths, and formats before processing
- SQL injection prevention: Never concatenate user input into SQL—use parameterized queries (SQLAlchemy handles this automatically)
- CSRF protection: Use Flask-WTF’s CSRF tokens to prevent cross-site request forgery attacks
- Rate limiting: Limit API requests per user/IP to prevent abuse and brute-force attacks
- HTTPS enforcement: Always use encrypted connections in production
Implement CSRF protection by including tokens in all forms and AJAX requests. Flask-WTF generates and validates these automatically when configured.
HTTPS configuration and environment variable management
Production deployments must use HTTPS. This encrypts all communication between clients and servers, protecting authentication credentials and sensitive data.
Use Let’s Encrypt for free SSL certificates. When deploying with Docker and nginx, configure nginx to handle HTTPS termination, providing certificates to clients and passing decrypted requests to your Flask application.
Store sensitive configuration in environment variables rather than source code:
Never commit database credentials, API keys, or secret tokens to version control. Use environment variables managed by your deployment platform, keeping production secrets separate from application code that developers can access.
The python-dotenv library loads environment variables from a .gitignore-protected .env file during development, while production systems use the platform’s native secret management.
How Can You Deploy Flask Dashboards to Production?
Development environments are convenient for building, but production requires different considerations. Real dashboards must be reliable, scalable, and manageable. Proper deployment architecture separates concerns and enables monitoring.
Containerizing Flask applications with Docker
Docker packages your Flask application with all dependencies into a self-contained image. This ensures your application runs identically across development, testing, and production environments.
Create a Dockerfile that specifies the base image, installs dependencies, and configures startup:
This file builds a Docker image containing Python 3.11, your application code, and all Python dependencies. Build the image with docker build -t my-dashboard:latest ., then run it with docker run -p 5000:5000 my-dashboard:latest.
Docker images are versioned, enabling rollbacks if problems arise. Push images to a registry (Docker Hub, AWS ECR, or private registries) for deployment to cloud platforms or your own servers.
Deploying to cloud platforms: Heroku, AWS, and DigitalOcean
Cloud platforms simplify deployment by handling infrastructure management. Each platform has different approaches suited to different needs.
- Heroku: Easiest for small projects and prototypes. Push code via Git, Heroku builds and deploys automatically. Limited customization but minimal operations overhead.
- AWS (Elastic Beanstalk, ECS): Powerful and scalable. More complex to configure but offers complete control and integrates with other AWS services.
- DigitalOcean (App Platform or Droplets): Middle ground between simplicity and control. App Platform automates deployment; Droplets give you a VPS to configure.
For AWS deployment, create an ECR repository, push your Docker image, then deploy using ECS or App Runner. For DigitalOcean, connect your Git repository and enable automatic deployment on push. For Heroku, install the CLI and run heroku create, then git push heroku main.
Configuring web servers and reverse proxies with Gunicorn and Nginx
The Flask development server isn’t suitable for production. Use Gunicorn as your application server—it runs multiple Flask processes, distributing requests across them. Use Nginx as a reverse proxy, handling HTTP requests, serving static files, and forwarding dynamic requests to Gunicorn.
Install Gunicorn and run your Flask application:
This command starts 4 Gunicorn worker processes listening on port 8000. Configure Nginx to forward requests to these workers and serve static files directly:
This Nginx configuration listens on port 80, forwards dynamic requests to Gunicorn, and serves static files without going through Flask. Use this architecture behind SSL termination (either Nginx with certificates or a load balancer).
This setup handles typical dashboard traffic efficiently. For extremely high traffic, add caching layers or database read replicas, but this foundation scales reliably for most applications.
Monitoring performance and handling scalability
Once deployed, monitor your dashboard’s health. Set up alerting for failures and performance degradation. Track metrics like response time, database query time, and error rates.
Use application performance monitoring (APM) tools to identify bottlenecks. Many cloud platforms include built-in monitoring. For self-hosted deployments, tools like Prometheus and Grafana provide comprehensive monitoring.
Plan for scaling from the start. If your dashboard’s user base grows, you’ll need additional resources. Design your application to run across multiple instances behind a load balancer. Ensure your database can handle increased query volume through optimization, indexing, or scaling strategies like read replicas.
Advanced Flask Dashboard Techniques: Real-Time Data and Automation
Basic dashboards display static snapshots of data. Advanced dashboards provide live updates, automated processing, and intelligent data transformations. These techniques create dashboards that truly drive business decisions.
Implementing WebSockets for live dashboard updates
WebSockets enable bidirectional communication between server and browser. The server pushes updates immediately when relevant data changes, without the browser continuously polling for changes.
Flask-SocketIO extends Flask with WebSocket support. Configure it and emit events when data updates:
On the client side, JavaScript listens for these events and updates dashboard display:
WebSockets create truly live dashboards. Stock price dashboards, operations monitoring, and real-time sales tracking all benefit from WebSocket updates. The trade-off is increased server complexity and memory usage from open connections.
Background tasks with Celery for scheduled data processing
Celery handles long-running tasks asynchronously. Instead of making users wait while Flask processes data, queue the work and return immediately. Celery picks up the task and processes it in the background.
Define Celery tasks for expensive operations like data imports, complex calculations, or report generation:
In your Flask route, queue the task instead of running it directly. The user gets an immediate response while processing happens in the background:
This pattern keeps dashboards responsive. Users never wait for slow operations to complete. Store results in cache or database so dashboards can display them once processing finishes.
Caching strategies to optimize dashboard performance
Caching stores query results temporarily, reducing database load and accelerating page loads. Different caching strategies suit different scenarios.
Page caching stores entire rendered HTML pages. For dashboards with frequent requests but infrequent data changes, caching entire pages provides maximum performance.
Query result caching stores database query results. When the same query executes within the cache window, return the cached result instead of querying the database again. Use Redis for reliable distributed caching:
Cache frequently accessed queries for minutes to hours depending on data freshness requirements. Dashboard key metrics might cache for 5-15 minutes. Invalidate cache immediately when underlying data changes to ensure accuracy.
Building automated report generation and exports
Many dashboards generate reports for distribution via email or download. Automate this with Celery and templating libraries. Create reports as HTML, PDF, or Excel files.
Use libraries like ReportLab for PDF generation or openpyxl for Excel files. Define a Celery task that gathers data, renders a template, and generates the output file:
Schedule these tasks with Celery Beat to run on a schedule. Generate executive summaries daily, weekly, or monthly automatically, delivering insights without manual effort.
Flask Dashboard Best Practices: Performance, Maintenance, and User Experience
Building a dashboard is one thing; building a maintainable, performant dashboard that scales is another. Best practices separate professional systems from hobbyist projects.
Code organization and maintainable project architecture
As your dashboard grows, organize code into logical modules. Use blueprints to group related routes:
This organization enables different developers working on separate features without merge conflicts. Each blueprint is self-contained with its own routes, templates, and static files.
Keep business logic in models and services, not in route handlers. This separation makes testing easier and allows reusing logic across multiple routes:
Separate concerns clearly: routes handle HTTP, services handle business logic, models represent data. This architecture scales from small dashboards to large applications.
Frontend optimization and lazy loading for large datasets
Dashboards displaying thousands of rows or millions of data points can overwhelm browsers. Optimize frontend performance through pagination, lazy loading, and data limiting.
Pagination displays data in pages. Load only the current page, reducing initial load time and memory usage. Implement pagination in both your API and frontend components.
Virtual scrolling (used by libraries like React-Window) renders only visible list items. When scrolling, the library dynamically loads new content, maintaining smooth performance even with massive datasets.
Lazy loading images and charts defers loading until elements enter the viewport. This accelerates initial page load substantially for dashboards with many visualizations.
Testing strategies for reliable dashboard functionality
Dashboards are data products. Accuracy matters. Test consistently to catch bugs and prevent data display errors.
Unit tests verify individual functions and services:
Integration tests verify routes work end-to-end:
Database tests verify queries return correct data. Use an in-memory SQLite database for tests, ensuring tests are fast and don’t interfere with production.
Aim for at least 70% test coverage for dashboard code. Test business logic thoroughly; you can be less rigorous with view rendering.
Documentation and version control workflows
Document your dashboard’s architecture, deployment process, and API endpoints. Future developers (including your future self) need to understand how the system works.
Create a README explaining project structure, installation, and local development setup. Document environment variables and configuration options. Add comments explaining non-obvious logic.
Use Git meaningfully. Create feature branches for development, make focused commits with clear messages, and maintain clean history. This enables understanding why changes were made and reverting specific changes if needed.
Ready to Build Your Flask Dashboard? Start Building Today
You now understand Flask’s capabilities for dashboard development, from basic setup through production deployment. The path from concept to deployed system is clear and achievable.
Recap of essential development steps
Every Flask dashboard project follows this progression. Start with a proper development environment using virtual environments. Structure your project with blueprints and the application factory pattern from the beginning.
Choose charting libraries matching your requirements—Chart.js for simplicity, Plotly for interactivity, D3 for custom visualizations. Connect to databases with SQLAlchemy, querying data efficiently. Secure access with authentication and role-based permissions.
Deploy using Docker and containerization. Configure Gunicorn and Nginx for production. Monitor and optimize from day one. As requirements grow, add WebSockets for real-time updates, Celery for background tasks, and caching for performance.
Resource recommendations for continued learning
The official Flask documentation provides complete API reference and tutorials. Miguel Grinberg’s Flask Mega-Tutorial covers advanced patterns and full-application development.
Consult SQLAlchemy documentation for ORM techniques. Review your chosen charting library’s documentation thoroughly—understanding library capabilities prevents reinventing functionality.
Practice by building dashboards for real problems. The best learning comes from shipping projects. Start small, add features incrementally, and deploy to real environments.
Common pitfalls to avoid during implementation
- Skipping database optimization: Poor queries dominate performance issues. Index strategically and profile queries early
- Mixing business logic with views: Controllers become unmanageable. Extract logic into services and models
- Hardcoding configuration: Use environment variables for all sensitive data and environment-specific settings
- Ignoring caching: Even small caches dramatically improve dashboard responsiveness
- Inadequate testing: Data dashboards must be accurate. Test business logic thoroughly
- Poor frontend architecture: Sprawling JavaScript without organization becomes difficult to maintain. Use frameworks for large dashboards
Frequently Asked Questions About Flask Dashboard Development
Can Flask handle large-scale dashboards with millions of data points?
Flask itself handles large dashboards fine—it’s not the limiting factor. The bottleneck is usually the database or frontend rendering. Query only visible data (with pagination or virtual scrolling) rather than loading millions of records. Aggregate data at the database level, returning summaries rather than raw records.
For truly massive datasets, consider specialized tools like Elasticsearch for fast data retrieval or column databases for analytical queries. Flask can certainly interface with these systems, aggregating their results for dashboard display.
What is the difference between Flask, Dash, and Streamlit for dashboard building?
Flask is a general-purpose web framework. It gives complete control but requires more code to build dashboards. Choose Flask when you need custom features, complex workflows, or integration with existing systems.
Dash is Plotly’s dashboard framework built on Flask. It provides pre-built components and handles many dashboard concerns automatically. It’s faster than Flask for typical dashboards but less flexible for unusual requirements.
Streamlit is a Python-first dashboard tool emphasizing simplicity. Write Python code, Streamlit renders a web UI automatically. It’s quickest for prototypes and data science applications but sacrifices customization.
Use Streamlit for rapid prototypes, Dash for standard business dashboards, and Flask for specialized requirements or when integrating with complex systems.
How do you handle real-time updates without overwhelming server resources?
WebSockets enable efficient real-time updates, but thousands of open connections consume significant server memory. Strategies for managing this include filtering data so users see only relevant updates, batching updates to avoid sending too frequently, and disconnecting inactive clients automatically.
Consider your user base. 50 concurrent WebSocket connections is trivial; 10,000 requires careful architecture. For large numbers of users, explore message queues and pub/sub systems that scale better than direct connections.
What are the best practices for securing dashboards in production environments?
Secure dashboards through layers. Start with HTTPS encryption, use strong authentication, implement role-based access control so users see only authorized data, validate all input, and keep dependencies updated.
Store sensitive configuration outside code via environment variables. Use database transactions to ensure data consistency. Log all access for audit trails. Run regular security audits and penetration tests to identify vulnerabilities before attackers do.
Consider compliance requirements for your industry. Financial dashboards need different security than internal tools. Determine your requirements early and build security in from the start—retrofitting it later is difficult and expensive.
Content management: RankFlow
Automate the SEO side of your projects
If you ship sites and keep having to write content for them, RankFlow handles the keyword research, drafting and rank tracking through an API — so it fits into your existing pipeline instead of adding another dashboard.